Canine pulmonary vein-to-pulmonary artery ratio: echocardiographic technique and reference intervals
Author information
Birettoni F., Caivano D., Patata V., Moïse N.S., Guglielmini C., Rishniw M., Porciello F. Canine pulmonary vein-to-pulmonary artery ratio: echocardiographic technique and reference intervals // J Vet Cardiol. 2016 Dec;18(4):326-335.
Abstract
OBJECTIVES: The size of the pulmonary veins (PVs) and pulmonary arteries (PAs) changes in response to hemodynamic alterations caused by physiological events and disease . We sought to create standardized echocardiographic methods for imaging the right ostium of the pulmonary veins (RPVs) and the right pulmonary artery (RPA) using specific landmarks and timing to quantify vessel diameters and phasic changes during the cardiac cycle.
ANIMALS: Fifty client-owned healthy dogs prospectively recruited.
METHODS: M-mode and 2-dimensional images were obtained from modified right parasternal long and short axis views. Right ostium of the pulmonary veins and RPA measurements were timed with electrical [peak of the QRS complex (RPVQRS and RPAQRS) and end of T wave (RPVT and RPAT)] or mechanical events [RPV and RPA vessels at their respective maximal (RPVMAX; RPAMAX) and minimal (RPVMIN; RPAMIN) diameters]. Right ostium of the pulmonary veins and RPA measurements were also indexed to the aorta.
RESULTS: In normal dogs regardless of the echocardiographic view or time in the cardiac cycle, the RPV/RPA ratio approximated 1.0. Mechanically timed fractional changes (distensibility indices) in RPV and RPA diameters did not differ (p=0.99; 36.9% and 36.8%, respectively). ECG-timed fractional changes (distensibility indices) in RPV and RPA diameter were at least 50% smaller than mechanically timed changes (p<0.05). RPV:Ao and RPA:Ao ranged between 0.3 and 0.6, with lower values obtained in diastole and larger values in systole (p<0.0001). Multiple positive and negative deflections were identified on the RPV and RPA M-mode tracings.
CONCLUSION: This study provides detailed methodology and 2D and M-mode reference intervals for the RPV and RPA dimensions and the phasic changes during the cardiac cycle of the dog using echocardiography.
KEYWORDS: Healthy dog; Index; Pulmonary artery distensibility index; Pulmonary vein distensibility index
Abbreviations
- Ao aorta
- LA left atrium/left atrial
- MPA main pulmonary artery
- RA right atrium
- RPA right pulmonary artery
- RPV right ostium of the pulmonary veins
- RPLA right parasternal long axis
- RPSA right parasternal short axis
- RPLA2D right parasternal long axis bidimensional echocardiography
- RPSA2D right parasternal short axis bidimensional echocardiography
- RPLAM right parasternal long axis monodimensional echocardiography
- RPSAM right parasternal short axis monodimensional echocardiography
- DRPA% right pulmonary artery distensibility index
- DRPV% right ostium of the pulmonary veins distensibility index
- RPAQRS right pulmonary artery diameter measured at the peak of the QRS RPAT right pulmonary artery diameter measured at the end of the T wave
- RPVQRS right ostium of the pulmonary veins diameter measured at the peak of the QRS
- RPVT right ostium of the pulmonary veins diameter measured at the end of T wave
- RPAMAX right pulmonary artery diameter measured at its maximum
- RPAMIN right pulmonary artery diameter measured at its minimum
- RPVMAX right ostium of the pulmonary veins diameter measured at its maximum RPVMIN right ostium of the pulmonary veins diameter measured at its minimum
Introduction
Pulmonary veins (PVs) and pulmonary arteries (PAs) are dynamic structures, which physically change their diameter during the cardiac cycle [1]. The vessel size depends on the volume of flow through the vessel , intravascular hydrostatic pressure, and vascular compliance. Pulmonary veins are more compliant than PAs and generally enlarge with increases in left ventricular end- diastolic pressure or increased pulmonary blood flow [2]. Pulmonary arteries enlarge with increases in pulmonary blood flow, pulmonary hypertension, idiopathic pulmonary artery dilatation or because of valvular or subvalvular pulmonic stenosis (poststenotic dilation) [2,3].
Considerable literature exists that addresses the pulmonary veins (PVs) size, anatomy, and function in humans as it pertains to the pathophysiology of ectopic atrial electrical activity, specifically, atrial fibrillation [4—6]. Similarly, several studies have examined these features of PVs in dog models of atrial fibrillation [7,8]. These studies determined that pulmonary veins (PVs) converge above the atria in a sphincter-like manner with a myocardial 'sleeve’ extending from the atria into the wall of the PV for 1—2 cm [9]. The anatomy of the pulmonary veins (PVs) is more complex in dogs than in humans [7] and correlates with echocardiographic imaging planes [10]. In both humans and dogs, pulmonary veins (PVs) fuse before entering the left atrium (LA) forming either four (humans) or three (dogs) ostia: in the dog the left cranial ostium, the dorso-caudal ostium, and the right ostium can be consistently identified. The right ostium of the PVs (RPVs)—comprised of the confluence of the right middle and the right cranial lobar PVs—is separated from the other two ostia by the right pulmonary artery (RPA) [10].
Clinicians routinely evaluate the relative size of pulmonary veins (PVs) and PAs on radiographs by comparing them to the size of the ribs [11—13]. Furthermore, the pulmonary vein and pulmonary artery associated with the same bronchus are approximately equal in size in normal dogs. During echocardiographic examinations, clinicians often evaluate RPV and right pulmonary artery (RPA) subjectively, but only three studies in dogs provide objective assessments of the RPV and right pulmonary artery (RPA) [14,15],e. These studies demonstrated that RPV:RPA and right pulmonary artery (RPA) distensibility decrease with pulmonary hypertension and RPV:RPA increases with increasingly severe mitral valve disease. Similarly, studies in humans [16,17] show that pulmonary hypertension affects both phasic or pulsatile changes in main pulmonary artery diameter.
Specifically, a linear correlation exists between the pulmonary artery pressure and the main pulmonary artery stiffness and distensibility as assessed via MRI [17—19] or echocardiography [16,20]. Whether similar phasic changes occur in pulmonary veins (PVs) with left heart disease is unknown. Additionally, the optimal imaging planes and timing of RPV and RPA measurements have not been determined. Finally, comparing these vessels to the aortic diameter could help identify diseases that result in similar changes in both the vessels.
Therefore, we sought to create a standardized echocardiographic method of imaging the RPV and right pulmonary artery (RPA) in clinically healthy dogs that could be used to assess cardiopulmonary disease status. Furthermore, we characterized RPV and RPA diameters and phasic changes using specific landmarks and timing and developed reference intervals for multiple right ostium of the pulmonary veins (RPV) and RPA variables.
Materials and methods
Animals
We prospectively recruited 50 dogs, considered healthy based on an unremarkable history, physical, electrocardiographic and echocardiographic examination. The study population included 33 females and 17 males with a median body weight of 18 kg (range 3—38 kg) and a median age of 4.1 years (range 1 —13 years).
Data acquisition
Echocardiogramsf were obtained with dogs in right lateral recumbency with the probe positioned on the right thorax through a fenestrated echocardiography table. One operator (FB) obtained standard and modified (see below) right parasternal long axis (RPLA) and short axis (RPSA) views in all dogs. Dogs were connected to the echo- cardiographic ECG monitor to facilitate timing of measurements. We acquired 2-dimensional (2D) views and saved cine-loops that contained at least three consecutive cardiac cycles. M-mode traces were obtained with a sampling frequency of 1,000 Hz and with the fastest possible sweep speed that display at least three consecutive cardiac cycles, in most dogs, this was 50 mm/s, but in some with slower heart rates, we used a sweep speed of 25 mm/s. All data were stored on a digital hard drive for subsequent off-line analysis.8
Aortic diameter was measured from the RPSA view, using an inner-edge-to-inner-edge method immediately after observing aortic valve closure, as previously described [21,22].
RPV and right pulmonary artery (RPA) echocardiographic views and measurements
The modifications to the standard 2D RPLA and RPSA views were performed as follows:
For the RPLA view, we visualized the RPV and RPA by moving the transducer apically and angling it dorso-cranially, allowing the scan sector to highlight the heart base. The M-mode cursor bisected the RPV, perpendicular to the long axis of the vein at a location where the venous walls were reasonably parallel (no longer converging). The cursor then bisected the right pulmonary artery (RPA) adjacent to the RPV through its maximal diameter. This view and the measurement points were used for both RPLA2D and RPLAM measurements (Fig. 1A).
For the RPSA view, we visualized the RPV and RPA by rotating the transducer 90° to obtain a somewhat oblique view of the heart base. In RPSA2D, the RPV appeared as a circle just above the linear RPA (Fig. 1B). The M-mode cursor bisected the cross-section of the RPV and then bisected the RPA perpendicular to the long axis of the artery.
Figure 1 Two-dimensional echocardiographic images of RPV(*) and RPA (+) from (A) the right parasternal long axis view and (B) the right parasternal short axis view.
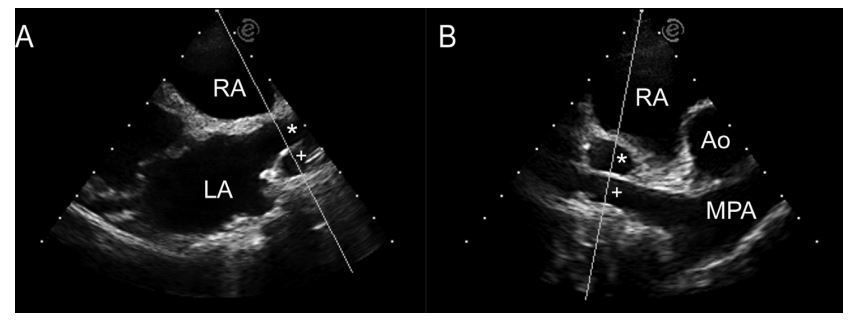
The M-mode cursor highlights the path used to transect the vessels forM-mode imaging. LA, left atrium; RA, right atrium; Ao, aorta; MPA, main pulmonary artery; RPV, right ostium of the pulmonary veins; RPA, right pulmonary artery.
We performed all measurements offline from archived cine-loop and M-mode images. M-mode images were obtained placing the M-mode cursor along the same line as the 2D measurements.
Timing of RPV and right pulmonary artery (RPA) echocardiographic measurements
We investigated two methods of measurements, based on either electrical or mechanical events.
For the electrically timed measurements, we measured right ostium of the pulmonary veins (RPV) and RPA diameters from the same cardiac cycles at the peak of the QRS, corresponding approximately to ventricular isovolumic contraction (RPVQRS and RPAQRS) and at the end of the T wave, corresponding to end systole (RPVT and RPAT). These measurements were performed on both the 2D and M-mode images (Fig. 2).
Figure 2 M-mode echocardiographic image of RPV (*) and RPA (+) from the right parasternal long axis view. The beat on the left of the image shows electrocardiographically timed measurements.
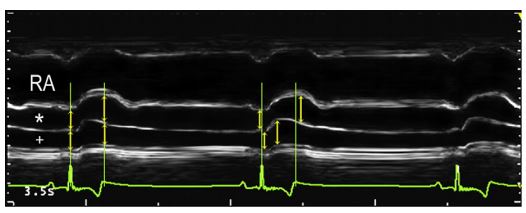
Green vertical lines depict the peak of the QRS complex and the end of the T wave. Yellow arrows highlight the measurements along these lines. The middle beat shows mechanically timed measurements, obtained at the maximum and minimum observable diameters (yellow arrows). Note the displacement of the arrows from the green vertical lines that denote the QRS complex peak and T wave termination. RA, right atrium; RPV, right ostium of the pulmonary veins; RPA, right pulmonary artery.
For the mechanically timed measurements, we measured the RPV and RPA vessels at their respective maximal (RPVMAX; RPAMAX) and minimal (RPVMIN; RPAMIN) diameters on the RPLAM only. We did not measure the respective vessel diameters at the same time point, but individually identified them subjectively by visual inspection of the RPV and right pulmonary artery (RPA).
Calculated variables
From the measured vessel diameters, we constructed several variables:
- RPV:RPA: the unitless ratio of the RPV to the RPA dimension. We calculated four different ratios deriving from measurements obtained from the RPLAview (RPVQRS:RPAQRS, RPVT:RPAT, RPVMAX:RPAMAX, RPVMIN:RPAMIN) and two different ratios deriving from measurements obtained from the RPSA view (RPVQRS:RPAQRS, RPVT:RPAT).
- RPV:Ao: the unitless ratio of the RPV to the aorta dimension, obtained at each measured time point: RPVQRS:AO, RPVT:Ao, RPVMAX:Ao, RPVMIN:A°.
- RPA:Ao: the unitless ratio of the RPA to the aorta dimension, obtained at each measured time point: RPAQRS:AO, RPAT:Ao, RPAMAX:Ao, RPAMIN:Ao.
- RPV distensibility index: DRPV%= (RPVMAX-RPVMIN)/RPVMAX*100 or (RPVT—RPVQRS)/RPVT*100
- RPA distensibility index: DRPA% = (RPA- MAX—RPAMIN )/RPAMAX*100 or (RPAT—RPAQRS)/ RPAT*100
Statistical analysis
Data were examined for normality using a Shapir- o—Wilk test. Because several variables were not normally distributed, we used non-parametric analyses for all comparisons. We performed a total of eight analyses, each at a nominal a = 0.05. We compared temporally similar variables using a Friedman test, with adjusted post-hoc multiple pairwise comparisons for the following sets of variables:
a. Minimal RPV:RPA: RPVMIN:RPAMIN (mechanically timed) from the RPLAM view was compared with RPVQRS:RPAQRS (ECG-timed) obtained from the RPLAM, RPSAM, RPLA2D and RPSA2D views.
b. Maximal RPV:RPA: RPVMAX:RPAMAX from the RPLAM view was compared with RPVT:RPAT obtained from the RPLAM, RPSAM, RPLA2D and RPSA2D views.
c. Maximal RPV:Ao: RPVMAX:Ao from the RPLAM view was compared with RPVT:AoT obtained from the RPLAM, RPSAM, RPLA2D and RPSA2D views.
d. Minimal RPV:Ao: RPVMIN:Ao from the RPLAM view was compared with RPVQRS:AOQRS obtained from the RPLAM, RPSAM, RPLA2D and RPSA2D views.
e. Maximal RPA:Ao: RPAMAX:Ao from the RPLAM view was compared with RPAT:AoT obtained from the RPLAM, RPSAM, RPLA2D and RPSA2D views.
f. Minimal RPA:Ao: RPAMIN:Ao from the RPLAM view was compared with RPAQRS:AOQRS obtained from the RPLAM, RPSAM, RPLA2D and RPSA2D views.
g. DRPV (%): (RPAMAX-RPAMIN)/RPAMAX*100 obtained from the RPLAM view was compared with (RPVt-RPVQRS)/RPAT*100 obtained from the RPLAM, RPSAM, RPLA2D and RPSA2D views.
h. DRPA (%): (RPAMAX-RPAMIN)/RPAMAX*100
obtained from the RPLAM view was compared with (RPAt-RPAQRS)/RPAT*100 obtained from the RPLAM, RPSAM, RPLA2D and RPSA2D views. We also examined intra-observer and interobserver measurement variability associated with measuring the vessels. First, we randomly selected five studies. Three investigators then measured the same beats three times independently. To determine inter-observer variability, we compared the averages of each variable for each study for each observer. We examined variability using two methods: first, we determined the average intra-observer and inter-observer coefficient of variation (CV) for each variable. Next, we determined the normalized maximum difference between the three measurements for each variable (either within observer or between observers) as described previously [21]. Briefly, the maximal difference between any two observers was divided by the average measurement of the three observers and expressed as a percentage. All analyses were performed with commercial statistical software.h
Results
Right ostium of the pulmonary vein and right pulmonary artery (RPA) evaluation in 2D and M-mode was feasible in all 50 dogs. In one dog, we could not obtain adequate images from the RPLA view; in two dogs we could not obtain adequate images from the RPSA view.
RPV and RPA waveform morphology
The M-mode tracing was characterized by multiple phasic deflections both of the RPV and RPA wall. We consistently identified one positive systolic, one positive and two negative diastolic deflections of the RPV (Fig. 2).
The positive systolic right ostium of the pulmonary veins (RPV) deflection began at the onset of the QRS (at the same instant as achieving the minimal diameter corresponding to late diastolic emptying of the LA during its contraction), reached its azimuth near the end of the T wave (at approximately the same time as achieving the maximal diameter corresponding to left ventricular isovolumic relaxation, just prior to mitral valve opening) and then quickly declined, leading to the first negative deflection in early diastole. This was then followed by a small positive deflection that continued either as a period of diastasis, or the second negative deflection (depending on the heart rate). The second diastolic negative deflection occurred just after the P-wave and reached a nadir at the onset of the QRS.
We identified one positive systolic deflection followed by a gradual diastolic decrease in the diameter of the RPA (Fig. 2). The positive deflection reached its azimuth near the end of the T wave, similar to that of the RPV, and declined to a nadir at the onset of the QRS.
We identified, albeit inconsistently, some additional deflections of the right ostium of the pulmonary veins (RPV) and right pulmonary artery (RPA). In the RPV, we occasionally identified a deflection immediately following the QRS complexwhich resulted in a notch within the systolic deflection. In the RPA, we occasionally identified a second positive deflection just after the end of the Twave in early diastole.
h MedCalc Statistical Software version 14.12.0 (MedCalc Software bvba, Ostend, Belgium
Calculated variables
The minimal RPV:RPA was approximately 1.0, without significant differences between echocardiographic views (long or short axis), ultrasound modality (2D and M-mode) and timing of the measurement (both at the QRS and T wave or based on electrical or mechanical events; p=0.66; Fig. 3, Table 1). However, the maximal RPV:RPA, which also approximated 1.0, differed with respect to echocardiographic view, modality and timing (p<0.00001; Fig. 4, Table 1).
The median RPV:Ao and RPA:Ao ranged from 0.3 to 0.6 (Fig. 5, Table 2). The unitless ratio of the RPV to the aorta dimension was larger than RPA:Ao when compared at similar time points (maximal or minimal diameter; p<0.004). Systolic RPV:Ao and RPA:Ao (occurring at the end of the T wave, or at maximal expansion) were larger than diastolic RPV:Ao and RPA:Ao (occurring at the QRS complex or maximal contraction) respectively (p<0.0001). Mechanically timed RPVMAX:Ao and RPAMAX:Ao were larger than ECG-timed measurements (p<0.05). Conversely, mechanically timed RPAMIN:Ao was smaller than ECG-timed measurements (p<0.05).
Figure 3 Boxplots of mechanically and electrocardio- graphically timed ratios of maximal RPV and RPA ratios obtained from different views
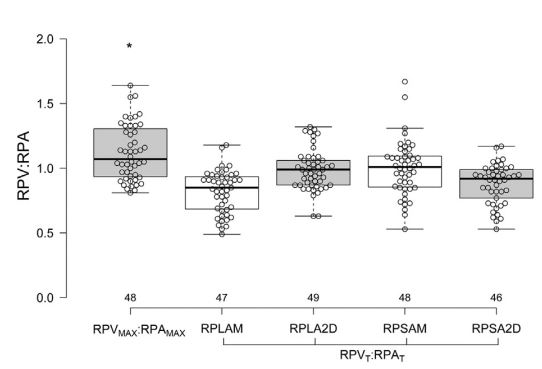
RPVMAX/RPAMAX = mechanically timed ratio of maximal RPV and RPA diameters; RPVT/RPAT = electrocardiographically timed ratio of RPV and RPA diameters obtained at the end of the T wave. The black line dividing each box denotes median, the bottom and top of the box denote the 25th and 75th percentile, and whiskers extend to data points that are less than 1.5*IQR away from 25th and 75th percentiles. The asterisk (*) denotes a difference between the mechanically timed variable and the corresponding ECG-timed variables (p<0.05). RPV, right ostium of the pulmonary veins; RPA, right pulmonary artery.
Table 1 Median 1st and 3rd quartile of RPV:RPA obtained in 50 healthy dogs by different measurement methods, echocardiographic views and timing.
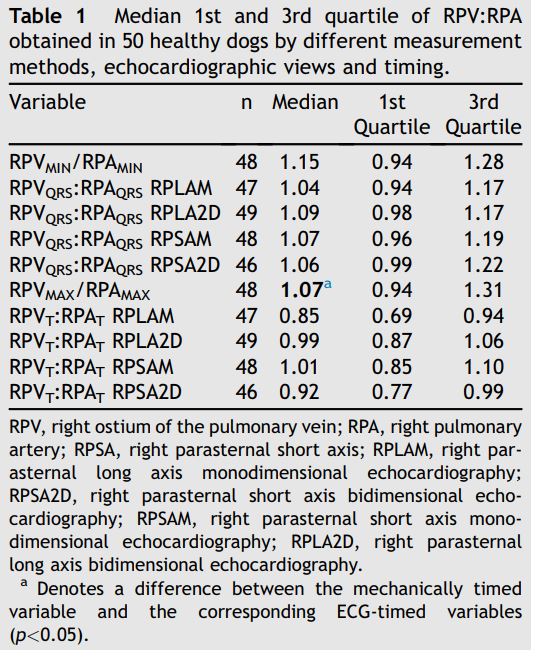
However, mechanically timed RPVMIN:Ao did not differ from ECG-timed measurements (p=0.09). Additionally, ECG-timed RPVMAX:Ao from the RPLAM was smaller than other ECG-timed measurements (p<0.05).
Figure 4 Boxplots of mechanically and electrocardiographically timed ratios of minimal RPV and RPA ratios obtained from different views
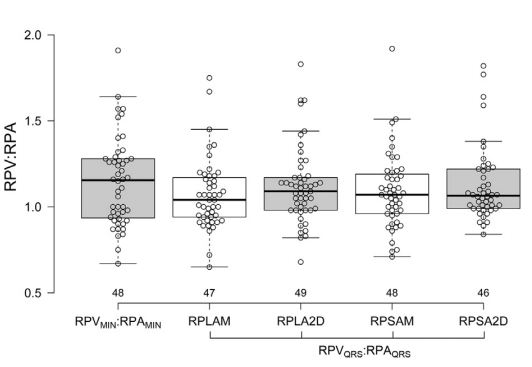
RPVMIN/RPAMIN = mechanically timed ratio of minimal right ostium of the pulmonary veins (RPV) and RPA diameters; RPVQRS/RPAQRS = electrocardiographically timed ratio of RPV and RPA diameters obtained at the QRS complex. No significant difference among the groups was found (p>0.05). See Figure 3 for Boxplot key. RPV, right ostium of the pulmonary veins; RPA, right pulmonary artery.
Figure 5 Boxplots of mechanically and electrocardiographically timed ratios of RPA or RPV and Ao obtained from different views
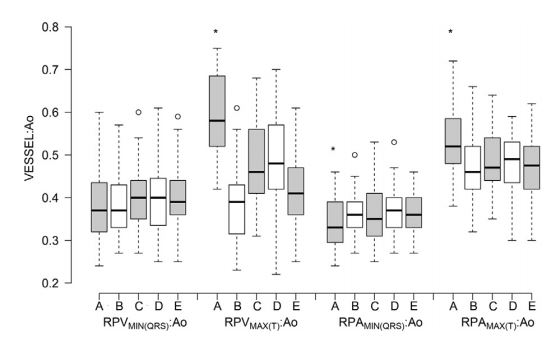
A = right parasternal long axis viewM-mode, mechanically timed; B = right parasternal long axis view M-mode electrocardiographically timed; C = right parasternal long axis view 2D, electrocardio- graphically timed; D = right parasternal short axis view M-mode electrocardiographically timed; E = right parasternal short axis view 2D, electrocardiographically timed. See Figure 3 for Boxplot key. RPVs, right ostium of the pulmonary veins; RPA, right pulmonary artery.
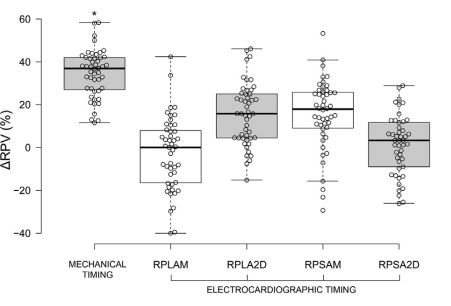
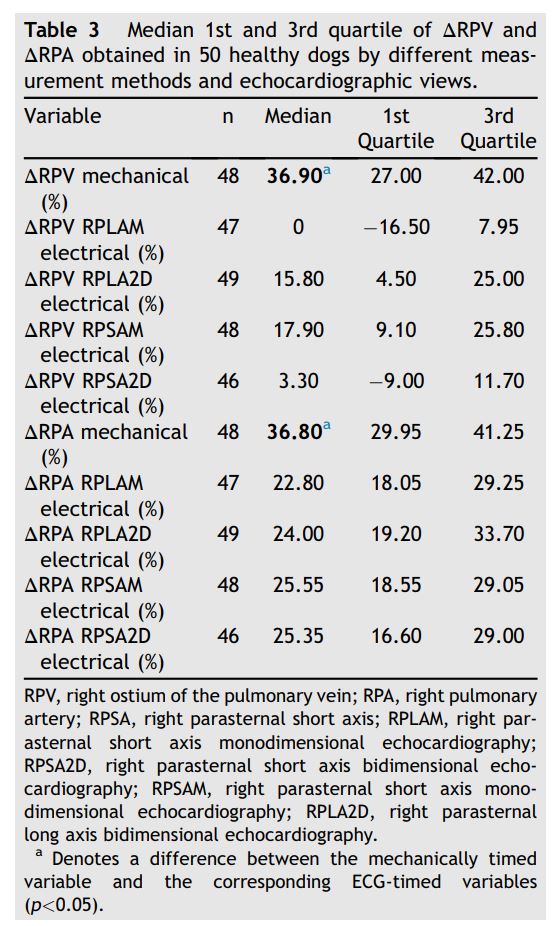
Median DRPV and DRPA were almost equal (36.9% and 36.8% respectively; Figs. 6 and 7, Table 3). Mechanically timed DRPV and DRPA were at least 50% larger than ECG-timed measurements (p<0.05, Table 1). ECG-timed measurements differed from each other for DRPV (p<0.05) but not for DRPA (p>0.05, Table 1).
Figure 6 Boxplots of mechanically and electrocardiographically timed distensibility indexes of the right ostium of the pulmonary veins (RPV) obtained from different views. See Figure 3 for Boxplot key. RPV, right ostium of the pulmonary veins.
Observer variability
Both intra-observer and inter-observer measurement variability was good, with average intraobserver CV <5.5% (highest individual intraobserver CV for any variable was 7.7%) and average inter-observer CV <5% (highest inter-observer CV for any variable was 6.5%). Similarly, the average normalized difference was <13% for all variables.
Discussion
We have comprehensively detailed the technique for measuring the RPV and RPA echocardiographically and provided reference intervals for several variables using both electrically and mechanically timed measurements. Our data show that several variables differ, depending on the timing of the measurement, and cannot be used interchangeably. Therefore, clinicians should report the method used and use the same method when serially evaluating patients. The right ostium of the pulmonary veins (RPV) and right pulmonary artery (RPA) diameters can be easily and reliably imaged by transthoracic echocardiography in healthy dogs using slightly modified right-sided long axis and short axis views to obtain M-mode images (or 2D images). The anatomical landmarks are easily detectable echocardiographically and correspond to vessels identified by previous investigators [10]. Intraobserver and inter-observer variability for measuring RPV and right pulmonary artery (RPA) are good, as evidenced by low average CV and normalized differences.
Figure 7 Boxplot of mechanically and electrocardiographically timed distensibility indexes of the RPA obtained from different views. See Figure 3 for Boxplot key. RPA, right pulmonary artery.
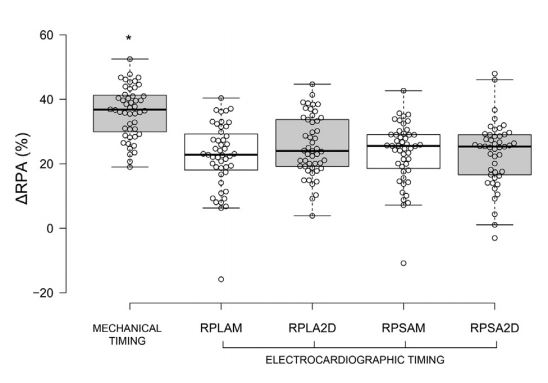
Table 3 Median 1st and 3rd quartile of DRPV and DRPA obtained in 50 healthy dogs by different measurement methods and echocardiographic views.
The echocardiographically derived ratio between the RPVs and the RPA (RPV:RPA) in healthy dogs approximates 1.0, similar to what has been documented radiographically [11—13]. This ratio is maintained in both systole and diastole.
On the other hand, the RPV:Ao and RPA:Ao vary considerably depending on the phase of the cardiac cycle, but range between 0.3 and 0.4 in diastole, and 0.5—0.6 in systole. We determined these ratios to ultimately examine their utility in pathological conditions where the diameters of both vessels potentially increase, e.g. pulmonary hypertension secondary to severe mitral valve disease.
We measured the RPV and RPA more comprehensively than investigators in a recent study, who limited their M-mode measurements to a single ECG-timed point, specifically, the end of the T wave [14]. While this measurement provides valuable information, we additionally examined the RPV and right pulmonary artery (RPA) (and RPV:RPA) at the peak of the QRS complex, and using mechanically timed events (maximal and minimal diameters of both vessels). These additional measurements allowed us to examine changes in RPV (DRPV) and RPA (DRPA). Furthermore, we determined RPV:Ao and RPA:Ao for reasons detailed above. All measurement methods and time points resulted in similar RPV:RPA (z1.0), a value also observed in the control dogs of the study by Merveille et al. [14]. However, we found that mechanically timed median DRPV and DRPA were greater than those obtained by ECG-timed measurements. This appears to be due to a noticeable dyssynchrony of the systolic movements of the vessels wall: the RPA reaches its maximum diameter several milliseconds before the right ostium of the pulmonary veins (RPV) (Fig. 2).
Interestingly, we found almost the same median DRPV as Chiang et al. [23] obtained by transesophageal echocardiography (37% vs. 35%) and a value comparable to that obtained by Lickfett et al. [24] in humans using MRI (39% for right superior PV and 31% for right inferior PV). Conversely, we found a median DRPA that was slightly lower than that obtained by Venco et al. [15] (37% vs. 44%) in normal dogs using transthoracic echocardiography, but substantially higher than obtained in humans (28%) [20]. All previous studies examined individual RPV or right pulmonary artery (RPA) variables, however, a combination of multiple echocardiographic indexes evaluated in our study (RPV:RPA, RPA:Ao and DRPA) might provide additional information for the diagnosis of pulmonary hypertension or severity of left heart diseases associated with CHF. Furthermore, this method could be particularly useful in situations where no spectral Doppler technology is available or significant tricuspid and pulmonary insufficiency are absent. Indeed, a preliminary study by other investigators supports this hypothesis.e
We did not observe markedly different measurement variability between ECG-timed and mechanically timed measurements, suggesting that neither method is superior. Additionally, we obtained measurement variability estimates at least as good as those obtained in the previous study [14]. However, whether methodological differences will become more apparent in diseased dogs remains undetermined.
We noted several phasic deflections within the RPV on the M-mode tracings. We hypothesize that the positive systolic RPV deflection is the result of increasing pressure inside the RPV due to the arrival of the blood ejected from the right ventricle, whereas the LA is already full and unable to empty against a closed mitral valve. Moreover, RPV is, in fact, LA myocardial tissue and follows the different phases of LA function trough the cardiac cycle [5]. During ventricular systole, the mitral annulus is drawn toward the left ventricular apex and the LA acts as an aspiration pump. Thus, at the end of the ventricular systole and prior to mitral valve opening, the LA, including the RPV, relaxes and is stretched apically. This action increases the volume of LA and RPV just prior to mitral valve opening [25]. The first diastolic negative RPV deflection occurs immediately after the systolic one as the mitral valve opens in the early ventricular diastole. The second diastolic negative RPV deflection occurs just after the P-wave, during atrial contraction and late diastolic atrioventricular blood flow. Atrial myocardial fibers extend into the pulmonary vein ostia, and these fibers are oriented circumferentially [5]. Therefore, atrial contraction constricts the RPV and reduces its dimension. We noted an occasional notch in the RPV tracing immediately after the onset of the QRS complex. We hypothesize that this deflection is due to a minimal increase in pressure inside the LA because of a mild reversal flow from the LA during its contraction or to the reflection of the mitral valve closure.
The positive systolic right pulmonary artery (RPA) deflection begins just after the QRS onset (at the same instant as achieving the minimal diameter), consistent with blood entering the PA from the right ventricle and distending it. The azimuth is reached near the end of the T wave (end of mechanical systole), and then the deflection declines throughout diastole, reaching its nadir at the onset of the QRS complex. These changes in the dimension mirror pulmonary artery pressure tracings obtained by catheterization [17]. We noted an occasional second positive deflection just after the end of the T wave in early diastole. This wave is due to the diastolic elastic arterial pulse, essentially a dichrotic notch, similar to that seen in an arterial pressure wave recording, as previously described [15]. Other factors as right ventricular systolic function, compliance of the pulmonary vascular tree, LA pressure or different phases of respiration can potentially influence diameter of the RPV and right pulmonary artery (RPA) during the cardiac cycle and require further investigation.
In our study transthoracic M-mode echocardiography allowed us to obtain a RPV trace very similar to that obtained by Chiang et al. [23] using transesophageal echocardiography or by Bowman et al. [1] using MRI. We also observed that RPV diameter showed a maximal increase at end systole and a minimal diameter at end diastole during LA contraction. This suggests that we were visualizing and sampling the venous ostium that contracts simultaneously with the LA. Eliakim et al. [9] have described the sphincter-like structures of the atrialpulmonary venous junctions in dogs. It is believed that this is a mechanism by which the pulmonary vasculature optimizes the filling of the left ventricle while avoiding blood flow back to the lungs.
This study has some limitations. We did not explore the influence of breathing, heart rate and changing of vessel location relatively to M-mode cursor on our indexes that could have increased the variability of our results. Moreover, we did not correlate our interpretations of the M-mode patterns of RPV and RPA deflections with invasively measured pressures in the different vessels and cardiac chambers. Finally, we did not examine observer variability for image acquisition. However, previous studies have suggested that this is similar to that of measurement variability [14].
Conclusions
We have developed a method of evaluation of RPV and RPA dimensions and phasic changes using conventional transthoracic echocardiography. These indices can be obtained in both RPLA and RPSA views and by 2D and M-mode echocardiography. M-mode imaging provides additional information about the phasic changes of these vessels that is not obvious from 2D still images. Whether these indices will allow clinicians to more precisely diagnose and manage their dogs with heart disease remains to be determined.
Conflicts of Interest
The authors declare no conflicts of interest.
Acknowledgments
The authors would like to express our gratitude to Dr Ekaterina Karaveva and Dr Fabio Spina for their support.
- References
- Bowman AW. Left atrial conduit volume is generated by deviation from the constant-volume state of the left heart: a combined MRI-echocardiographic study. AJP Heart Circ Physiol 2004;286:H2416—24.
- Kittleson MD. Ch 4: radiography of the cardiovascular system. In: Kittleson MD, editor. Small Animal Cardiovascular Medicine. 2nd ed. Davis, CA: Veterinary Information Network; 2005, beta.vin.com/doc/?id=5496488&pid =5928 .
- Chia BL, Ee BK. Two-dimensional and Doppler echo- cardiographic abnormalities in idiopathic dilatation of the pulmonary artery. Singap Med J 1996;37:378—9.
- Tan AY, Li H, Wachsmann-Hogiu S, Chen LS, Chen P-S, Fishbein MC. Autonomic innervation and segmental muscular disconnections at the human pulmonary vein-atrial junction: implications for catheter ablation of atrialpulmonary vein junction. J Am Coll Cardiol 2006;48:132—43.
- Hassink RJ, Aretz HT, Ruskin J, Keane D. Morphology of atrial myocardium in human pulmonary veins: a postmortem analysis in patients with and without atrial fibrillation. J Am Coll Cardiol 2003;42:1108—14.
- Ho SY, Cabrera JA, Tran VH, Farre J, Anderson RH, San- chez-Quintana D. Architecture of the pulmonary veins: relevance to radiofrequency ablation. Heart 2001;86: 265—70.
- Verheule S, Wilson EE, Arora R, Engle SK, Scott LR, Olgin JE. Tissue structure and connexin expression of canine pulmonary veins. Cardiovasc Res 2002;55:727—38.
- Hamabe A, Chang C-M, Zhou S, Chou C-C, Yi J, Miyauchi Y, Okuyama Y, Fishbein MC, Karagueuzian HS, Chen LS, Chen P-S, Akira H. Induction of atrial fibrillation and nerve sprouting by prolonged left atrial pacing in dogs. Pacing Clin Electrophysiol 2003;26:2247—52.
- Eliakim M, Stern S, Nathan H. Site of action of hypertonic saline in the pulmonary circulation. Circ Res 1961;9: 327—32.
- Brewer FC, Moise NS, Kornreich BG, Bezuidenhout AJ. Use of computed tomography and silicon endocasts to identify pulmonary veins with echocardiography. J Vet Cardiol 2012;14:293—300.
- Oui H, Oh J, Keh S, Lee G, Jeon S, Kim H, Yoon J, Choi J. Measurements of the pulmonary vasculature on thoracic radiographs in healthy dogs compared to dogs with mitral regurgitation. Vet Radiol Ultrasound 2015;56:251—6.
- Bahr RJ. The heart and pulmonary vessels. In: Thrall DE, editor. Textbook of Veterinary Diagnostic Radiology. St Louis, MO: Saunders; 2013. p. 585—607.
- Dennis R, Kirberger RM, Barr F, Wrigley RH. Handbook of small animal radiology and ultrasound — techniques and differential diagnosis. 2nd ed. St Louis, MO: Saunders; 2010. p. 145—73.
- Merveille A-C, Bolen G, Krafft E, Roels E, Gomart S, Etienne A-L, Clercx C, Mc Entee K. Pulmonary vein-to- pulmonary artery ratio is an echocardiographic index of congestive heart failure in dogs with degenerative mitral valve disease. J Vet Intern Med 2015;29:1502—9.
- Venco L, Mihaylova L, Boon JA. Right Pulmonary Artery Distensibility Index (RPAD Index). A field study of an echocardiographic method to detect early development of pulmonary hypertension and its severity even in the absence of regurgitant jets for Doppler evaluation in heartworm-infected dogs. Vet Parasitol 2014;206:60—6.
- Wu D-K, Hsiao S-H, Lin S-K, Lee C-Y, Yang S-H, Chang S-M, Chiou K-R. Main pulmonary arterial distensibility: different presentation between chronic pulmonary hypertension and acute pulmonary embolism. Circ J 2008;72:1454—9.
- Jardim C, Rochitte CE, Humbert M, Rubenfeld G, Jasinowodolinski D, Carvalho CRR, Souza R. Pulmonary artery distensibility in pulmonary arterial hypertension: an MRI pilot study. Eur Respir J 2007;29:476—81.
- Sanz J, Kariisa M, Dellegrottaglie S, Prat-Gonzalez S, Garcia MJ, Fuster V, Rajagopalan S. Evaluation of pulmonary artery stiffness in pulmonary hypertension with cardiac magnetic resonance. J Am Coll Cardiol Cardiovasc Imaging 2009;2:286—95.
- Bogren HG, Klipstein RH, Mohiaddin RH, Firmin DN, Underwood SR, Rees RS, Longmore DB. Pulmonary artery distensibility and blood flow patterns: a magnetic resonance study of normal subjects and of patients with pulmonary arterial hypertension. Am Heart J 1989;118: 990—9.
- Ertan C, Tarakci N, Ozeke O, Demir AD. Pulmonary artery distensibility in chronic obstructive pulmonary disease. Echocardiography 2013;30:940—4.
- Georgiev R, Rishniw M, Ljungvall I, Summerfield N. Common two-dimensional echocardiographic estimates of aortic linear dimensions are interchangeable. J Vet Cardiol 2013;15:131—8.
- Dickson D, Caivano D, Patteson M, Rishniw M. The times they are a-changin': two-dimensional aortic valve measurements differ throughout diastole. J Vet Cardiol 2016; 18:15—25.
- ChiangHua C, Hagio M, Okano S, Chiang CH, Hagio M, Okano S. Effects of respiratory cycle on pulmonary venous flow and cardiac cycle on pulmonary venous diameter of dogs: a transesophageal echocardiography study. J Vet Med Sci 1999;61:155—8.
- Lickfett L, Dickfeld T, Kato R, Tandri H, Vasamreddy CR, Berger R, Bluemke D, Luderitz B, Halperin H, Calkins H. Changes of pulmonary vein orifice size and location throughout the cardiac cycle: dynamic analysis using magnetic resonance cine imaging. J Cardiovasc Electrophysiol 2005;16:582—8.
- Bowman AW, Kovacs SJ. Prediction and assessment of the time-varying effective pulmonary vein area via cardiac MRI and Doppler echocardiography. Am J Physiol Heart Circ Physiol 2005;288:280—6.
^Наверх


